|
Harshit Agarwal I'm a Post Graduate student at IIIT Bengaluru. Through my coursework and projects, I have gained practical experience in cleaning and analyzing datasets, applying statistical and analytical techniques to uncover patterns, and presenting insights in a clear and effective way. Previously, I was responsible for managing and running my family business, where I handled client negotiations, built strong relationships, and ensured smooth day-to-day operations to manage and grow the business. |

|
|
IIIT Bangalore
|
MinkWhite
|
BMSIT Bengaluru
|
VisualizationsAll visualizations made using Tableau. |
|
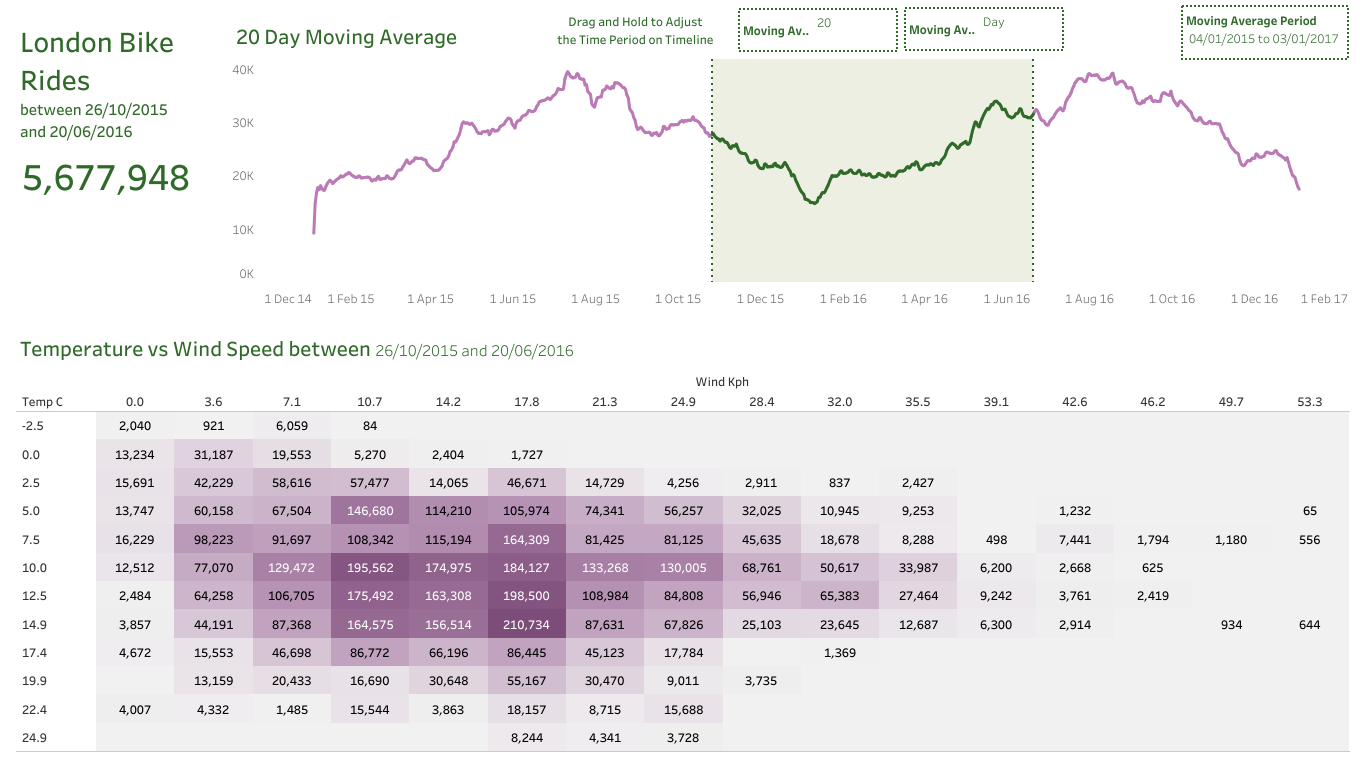
London Bike Rides (Kaggle Dataset).
Developed an interactive Tableau dashboard to analyze London bike ride data, uncovering trends in ride demand across different time periods, weather conditions, and seasons. The dashboard visualizes key metrics such as total rides, moving averages, and the relationship between bike usage and environmental factors like temperature and wind speed, enabling users to identify peak ride hours and patterns in rider behavior. |
|
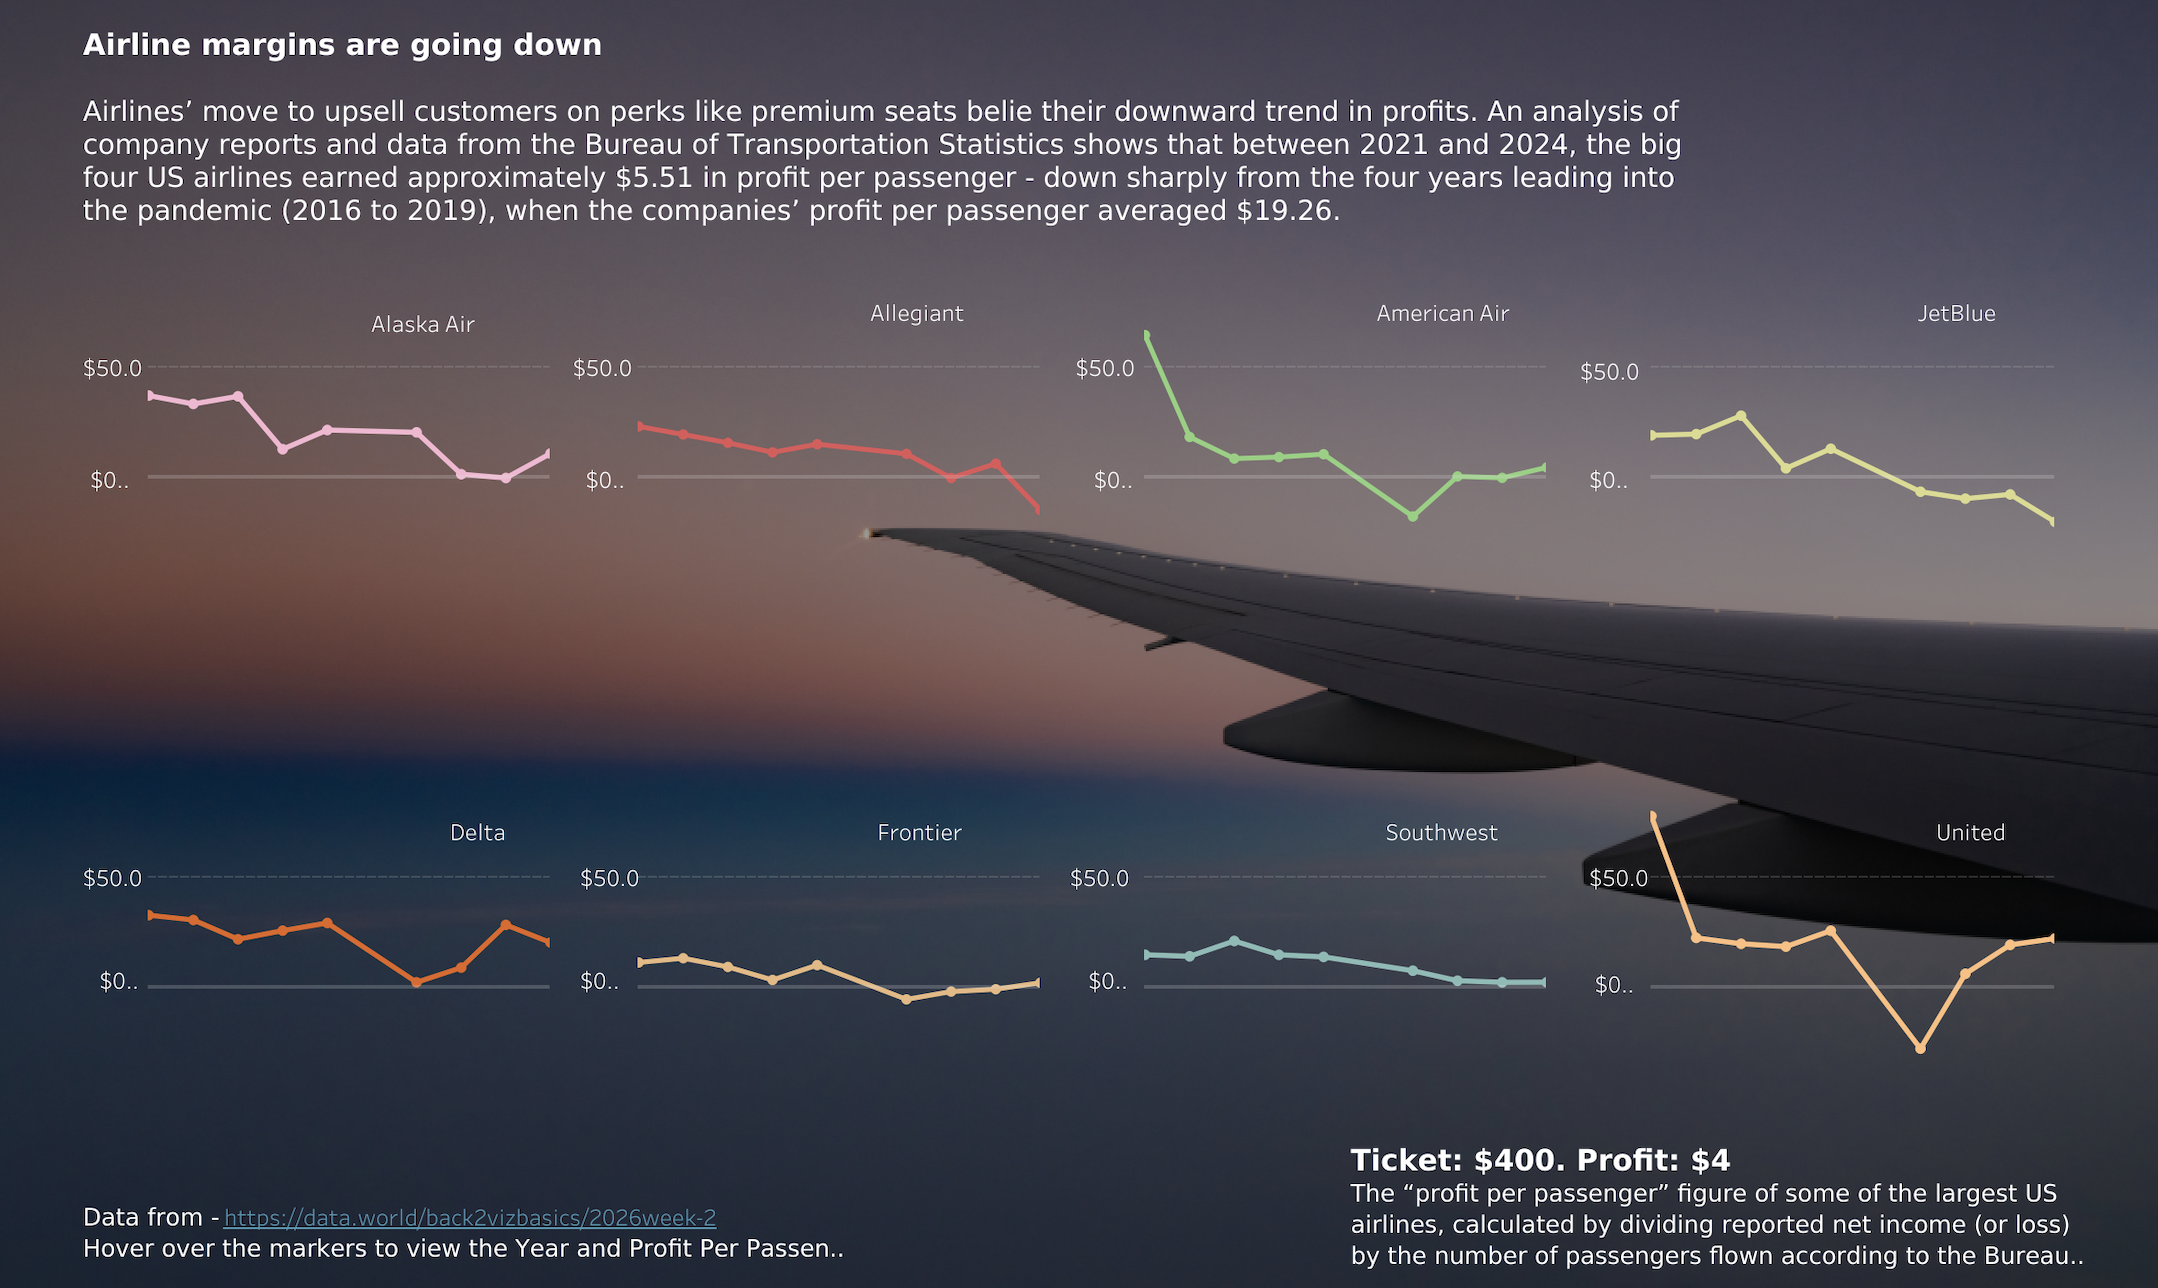
Impact of COVID-19 on Airline Profits.
This line chart based Dashboard visualizes profit per passenger for major U.S. airlines over time, highlighting how airline profitability evolved before and after the COVID-19 pandemic. By tracking yearly performance, the chart clearly shows the sharp financial disruption during the pandemic period and have a continued effect on the profits. |
|
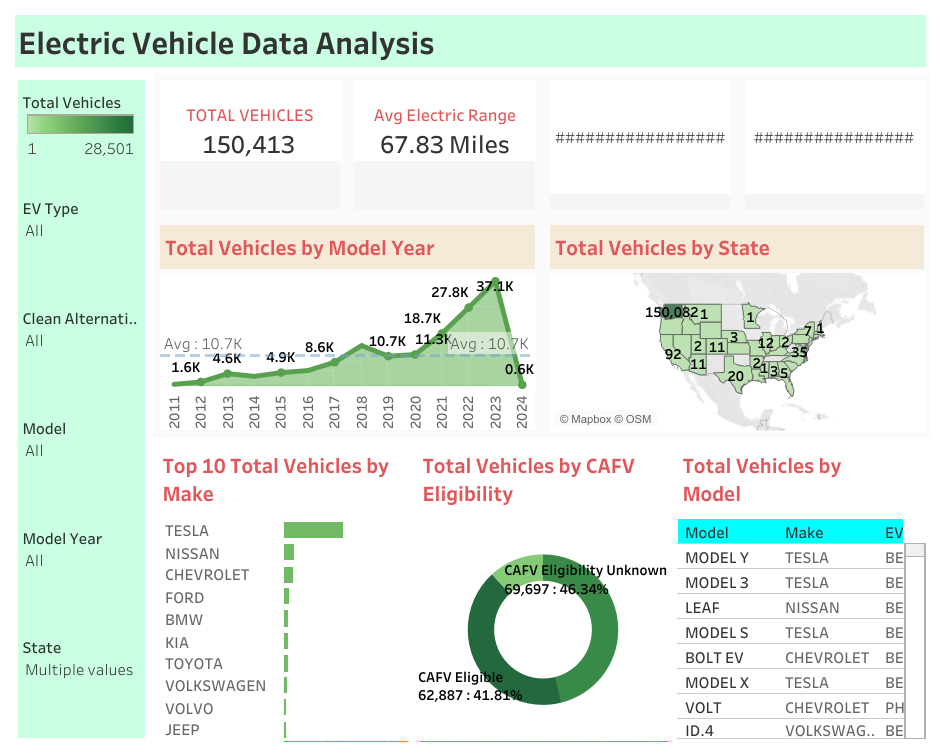
Electric Vehicle Data Analysis Visualization
This is workbook of Tableau, visualizing the dataset of Electric Vehicle Population Data. It was designed by keeping various KPI Requirements such as Average Electric Range, Total BEV Vechicles Relative to Total Vehicles, Total PHEV Vehicles Relative to Total vehicles etc. Charts like Line/Area chart, Map Chart, Pie/Donut Chart, Bar Chart etc were used in Visualization and finally a Dashboard was made for Data Discovery. |
|
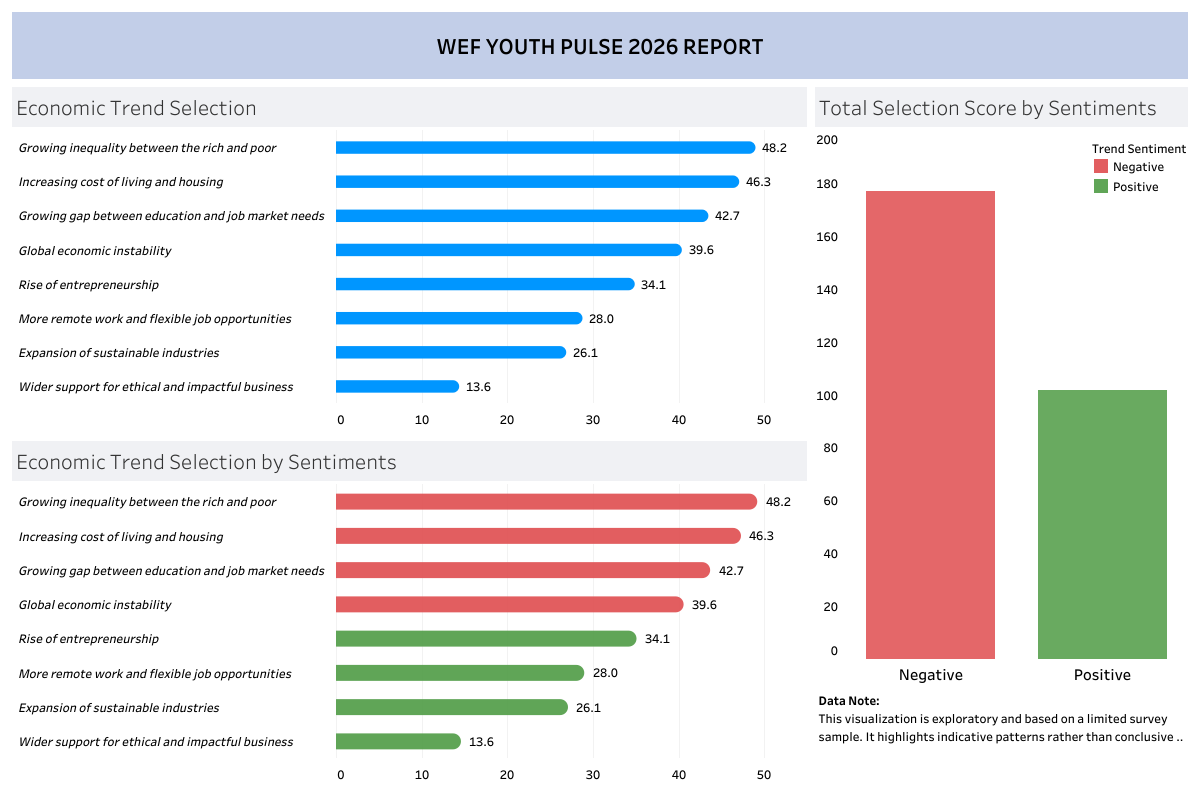
WEF Youth Report - B2VB Challenge Visualization
This is workbook of Tableau, visualizing the dataset of WEF Youth Report. Dataset Link can be found Here. |
|
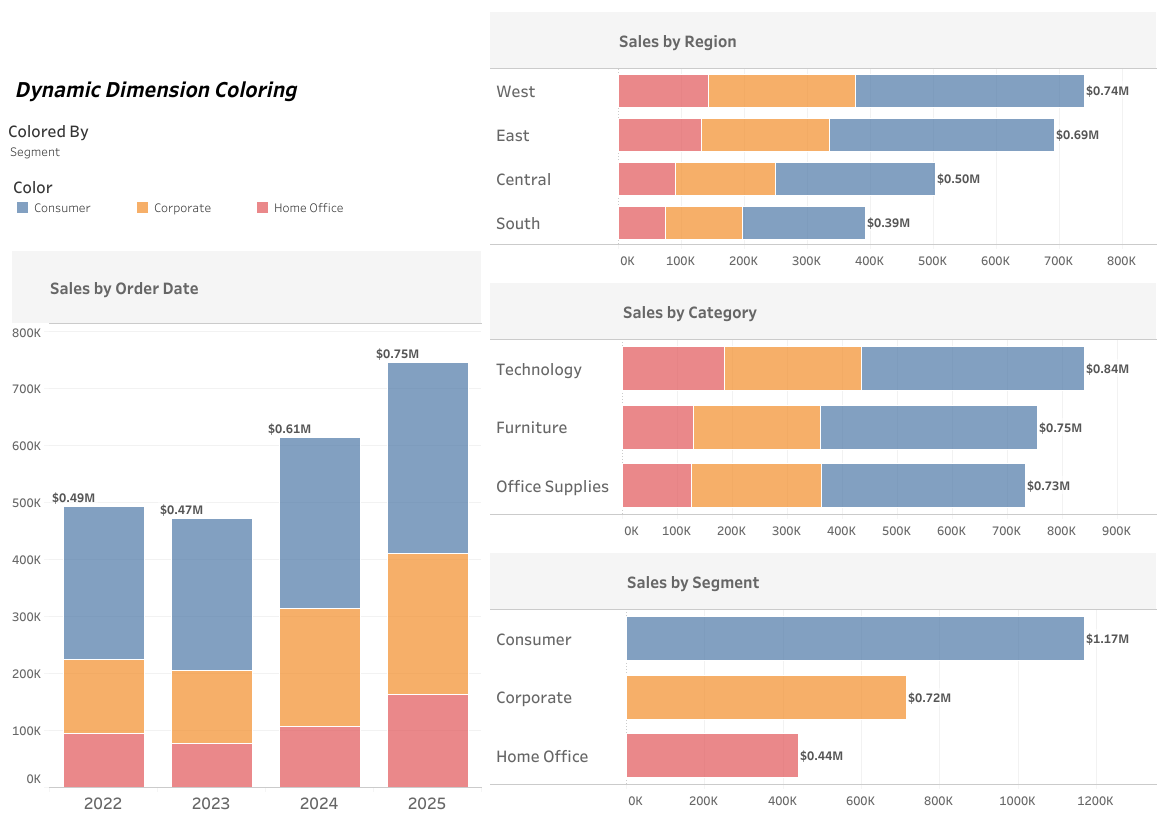
Dynamic Dimension Coloring
This visualization addresses the challenge of enabling users to dynamically change the dimension that drives color across all charts in a dashboard. Because the available dimensions may evolve over time, the solution is designed to be flexible and easy to maintain. The focus is on creating an approach that ensures consistent color behavior, simplifies future updates, and enhances overall dashboard usability. |
Data AnalysisProjects based on analysing Datasets, mostly comprising of EDA, Feature Engineering processes for the Data. |
|
Insurance Pricing forecastor Using XGBoost
Numpy, Jupyter Notebook, Pandas, Matplotlib, XGBoost
Built a XGBoost Regression Model to that helps establish the rates of premium by predicting the
charges or payouts done by the firm.
Achieved a total of 15-20% improvement in RMSE over baseline models such as Linear Regression. The
approach for the
project was |
|
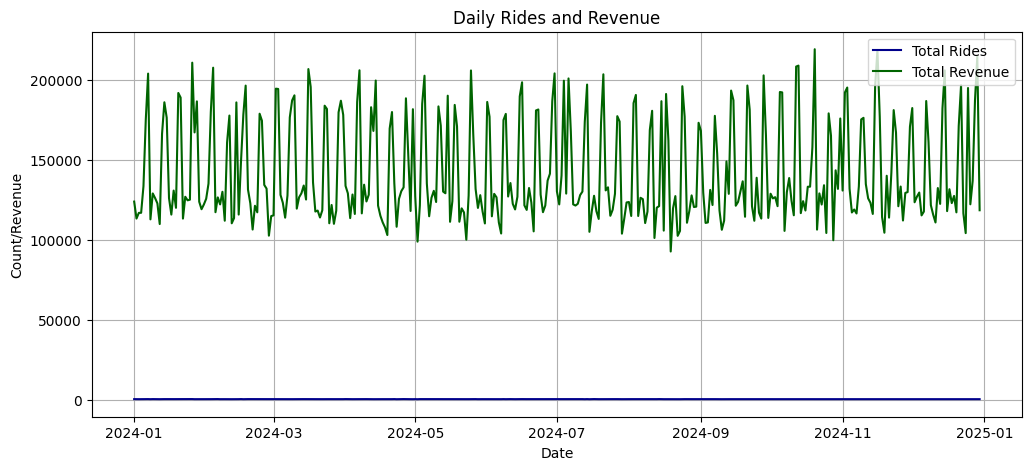
Uber Data Analysis
Numpy, Jupyter Notebook, Pandas, EDA, Matplotlib
This project analyse the Uber dataset provided in Kaggle. |
|
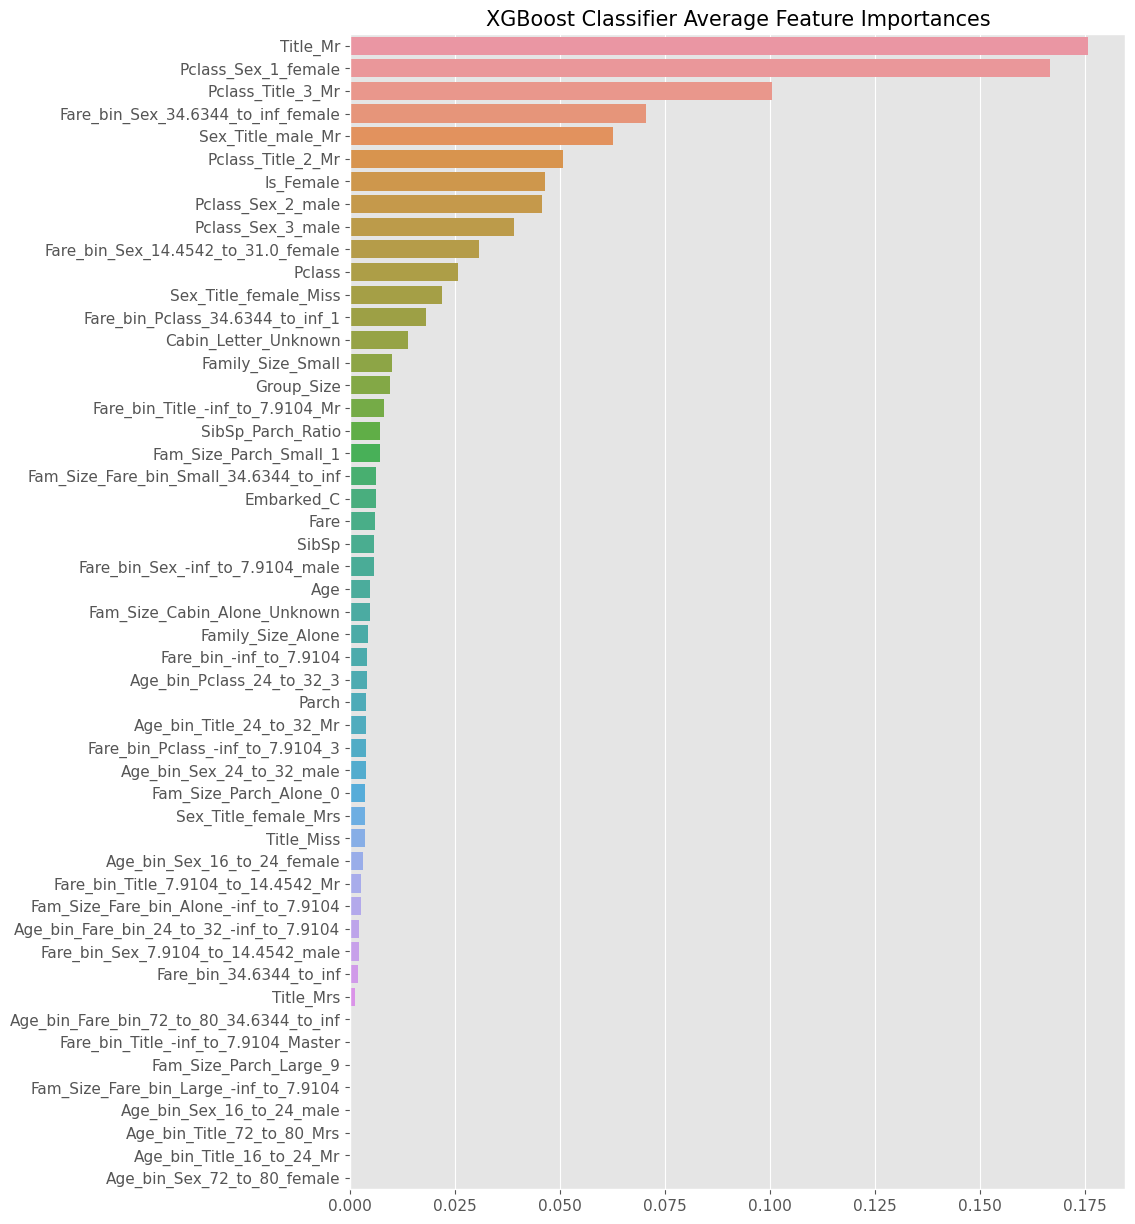
Titanic - Machine Learning from Disaster - Kaggle Competition
Python, Numpy, Pandas, Matplotlib, Machine Learning This project analyse the Titanic - Machine Learning from Disaster dataset provided in Kaggle. |
Hobbies and Interests |
|
Qiskit Practice Notebooks
Qiskit, Quantum Circuits, Jupyter Notebook, Python Implementing Quantum Ciruits |

|
Amazon ML Challenge 2025
Machine Learning, Jupyter Notebook, Python, Transformers Ranked 794 amongst 20,000+ Participated Teams
Problem Description - In e-commerce, determining the optimal price point for
products is crucial for marketplace success and customer satisfaction.
Develop an ML solution that analyzes product details and predict the price of the product. We used TF-IDF Vectorization for text data and LightGBM Regression on numerical features extracted from the catalog content. |
|
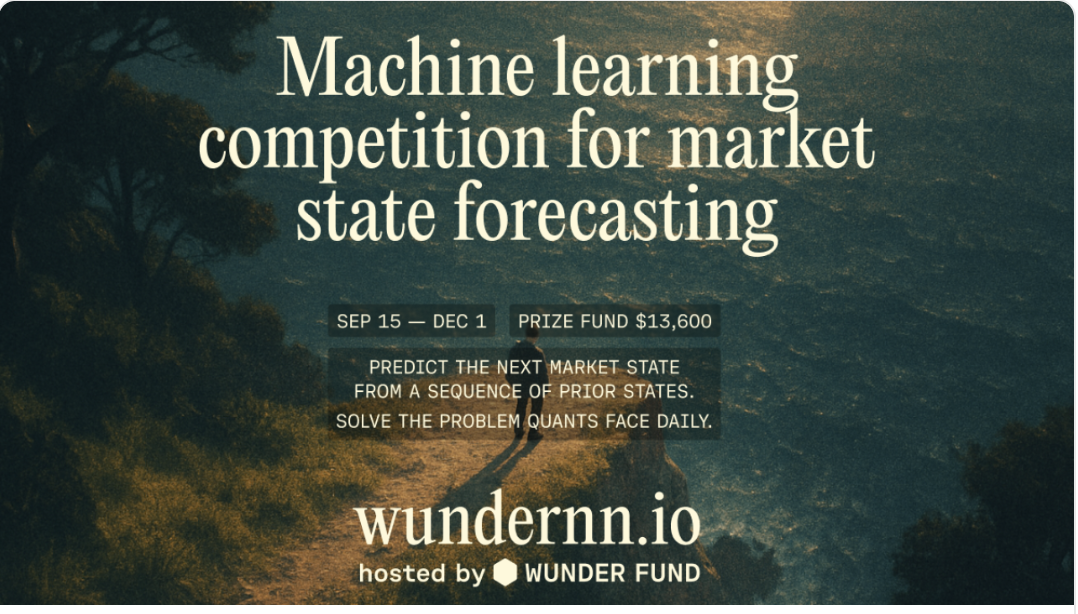
Wunder Fund RNN Challenge
Machine Learning, Python, LSTM Achieved a Rank of 457 amongst 4400+ Participants. Problem Description - In this competition, you are invited to build a model that predicts the next market state from a sequence of prior states. This is a very challenging endeavor due to the complexity of the data: many standard time-series statistical assumptions are not met here. Yet the problem is feasible — Wunder Fund's 10 years of successful trading prove it. The task mirrors problems quantitative researchers face daily. You'll have to be smart — in the HFT domain, inference needs to be made under very tight time constraints, so any practical solution must be nimble enough to run on CPU. |
Articles |
Writing space for product portfolio notes, project breakdowns, and longer-form updates. Start with the articles index or read the first article here. |
Papers |
Under Construction |
|
Source code from Jon Barron |